Step 4: Derive each car’s age
Looking at the view of the Year column (year of production), notice it only contains two digit values, like 70 or 72. This is not a useful attribute for analysis as these values have no real magnitude or method for comparison. Instead, as we know that the data was collected in 1982, we can calculate the age of each car at the time the test was performed. The age will be much more useful for comparison between cars.
We can add in age by creating a new column for age that obtains its value by evaluating a function of the corresponding year. In simpler terms, if we know that it is 1982, and we know the year is 70, we can calculate the difference via subtraction. To create columns in a dataset we can use the Derive node, which derives values of new columns. Essentially, the Derive node creates a copy of the original dataset that includes one or more new columns.
Add a Derive node from the Column Operations section in the node palette. You can place the node anywhere you feel convenient. Many users find it intuitive to place nodes on the flowchart from left to right, like words in English, as the metaphor of building a sequence of nodes is highly similar to constructing a sentence.
If you prefer right clicking over drag-and-drop, you can add and connect a new Derive node by right clicking on the CSV Source node on your flowchart and selecting Add > Column Operations > Derive. Experienced users may find this method more convenient.
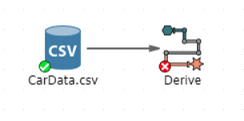
Connect the CarData.csv node to the Derive node (unless you used the Add right click menu option). Сonnecting nodes is introduced in the topic Forming node sequences. Your flowchart should now look similar to the following:
Open the properties of the Derive node, and add a new column named Age. To add a new column, click the Add button near the top of the Derive node properties dialog. A new column will appear in the list of columns on the left:
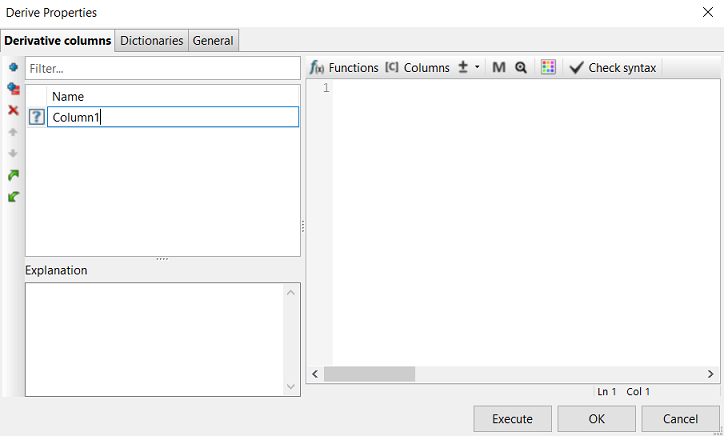
The name will appear selected. You can edit the name of the column as you add it (or later you can rename it) by typing into this area the name of the column. When finished entering the name, you can either hit the Enter key or click somewhere else on the dialog to complete the naming operation. The question mark to the left of the new column name means that the node does not know which type of data the column will contain so far. Most of the time it is wise to immediately click in the large text area on the right side of the dialog. This area is editable and is where you can enter the expression that will be evaluated when the Derive node is executed for each record of the input dataset to calculate the corresponding value of the new column (in this case, Age).
Set the expression for Age to: 82 - [Year].
You can type directly into the expression area as shown in the following screenshot (just make sure you clicked on it first so that you see a blinking cursor).
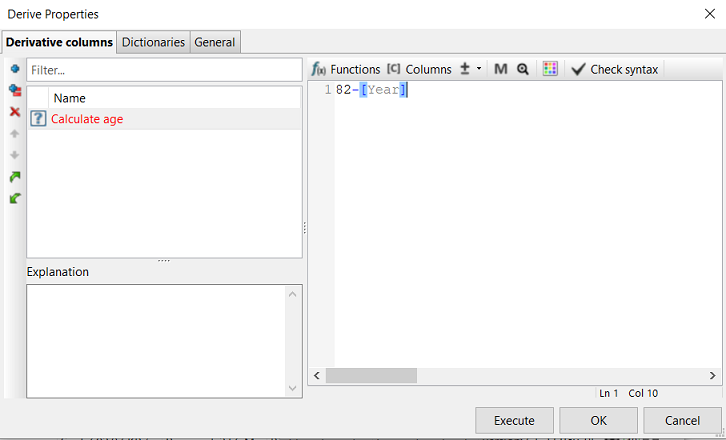
| Ensure you have the name of the new column selected when you are entering in the expression. Notice how the column’s background in the above screenshot is a blue color to show it is selected. Otherwise, your expression may not be saved and you will not be able to execute the node. |
PolyAnalyst’s Symbolic Rule Language
The syntax used to generate the value for the new column is PolyAnalyst’s Symbolic Rule Language, SRL. SRL is a powerful, calculator-like language that lets you write an immense variety of expressions, ranging from simple addition and subtraction to matrix statistics and value manipulation. You do not need to master the SRL language at this point, but you are recommended to take some time later on to review the basics of the SRL language so that you can interpret SRL expressions and begin writing your own. Some of the results produced by PolyAnalyst nodes are expressed in SRL.
If you have a background in mathematics, or have worked with functions inside Microsoft Excel, you will have a good head start at writing your own SRL expressions. PolyAnalyst’s SRL syntax is not very different, barring a few custom functions and options specific to the software. One of the roles of SRL is to fill out some of the missing data transformation and manipulation features available through nodes which offer you buttons and fields to fill in. Some operations are so rarely used that it would be more inconvenient to have a node for each one than to just a simple, flexible SRL expression. The Derive node at first seems limited in its functionality in that it is only used to create columns, but its functionality is rather endless given the expressive power of SRL. With SRL you can perform operations like changing the data type or format of a value, add, subtract, multiply, find exponents, take square roots, concatenate and split strings, find sums and means and modes, find date ranges, perform value comparisons, and use if-statements.
Using column names in SRL expressions
When working with column names in SRL, you will need to first enclose the column name inside brackets, as in [Year], if the name contains spaces, non-alphabetical or numerical characters, or if the name is identical to the name of an SRL function or operator. The word Year does not have any spaces and only consists of alphabetical characters, however, the brackets are necessary because the word 'year' is also the name of an SRL function. The year function extracts the year value from a date.
Some users prefer to retain the brackets around column names always to prevent possible confusion via a standard approach and to emphasize names of columns. Other users prefer to leave out the brackets to reduce the overall length of the expression. It is wise to pick a preference at this point and stick with it, but maintain the ability to interpret either method of entering a column name into an expression.
Adding a column name to an SRL expression
Click the Columns button located above the expression editor. Navigating to the Columns tab and double-clicking on the name of any column in the list (it displays all the columns from the incoming connected node, which in this case is our CSV Source node), automatically inserts the name of column into the expression.
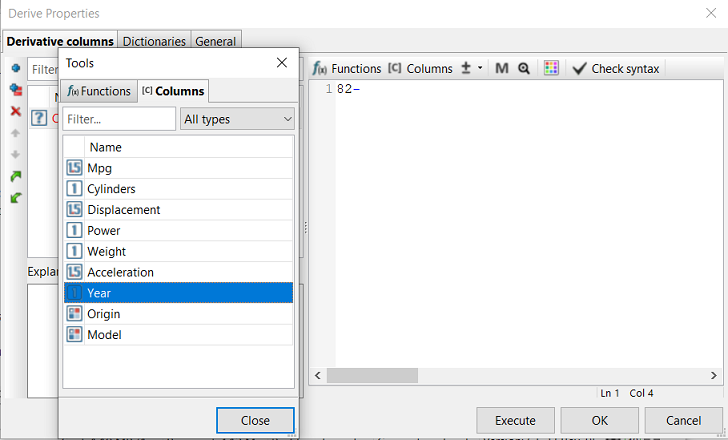
You might find this method more convenient in contrast with typing out [Year] in the expression editor. It also helps prevent spelling mistakes, which can be a source of inconvenience when writing more advanced expressions as you become more experienced, as well as when you work with a dataset of 10,000 columns or with very long column names.
Checking expression syntax
After entering the expression, you can optionally click the Check syntax button located above the expression editor (you can’t see it in the pictures above because the dialog was reduced in size for the sake of convenience). The Check syntax button evaluates the expression for the currently selected new column in the list on the left (in our case this is Age). If an error is found, you will receive an error message that may help you find the error in the expression. If no error is found, PolyAnalyst fills in the return type of the expression. The number 82 is an integer, and the Year column is an integer (we set this in the data source earlier). An integer subtracted from an integer yields an integer. Therefore, the return data type for the new column, Age, is the Integer data type, and this data type represented by the 1 icon in the list on the left next to the name of the new column that appears once you click the Check syntax button. If you do not click the button, PolyAnalyst will check the syntax anyway when you decide to click OK or Execute (which are essentially the only two ways to close this Properties window and keep your changes, as clicking Cancel closes it without saving the changes, in which case estimating the data type becomes irrelevant). The Check syntax button is not a required step, it is an optional step that is useful when writing more complicated and lengthy expressions where you want to validate your expression as you type it in parts.
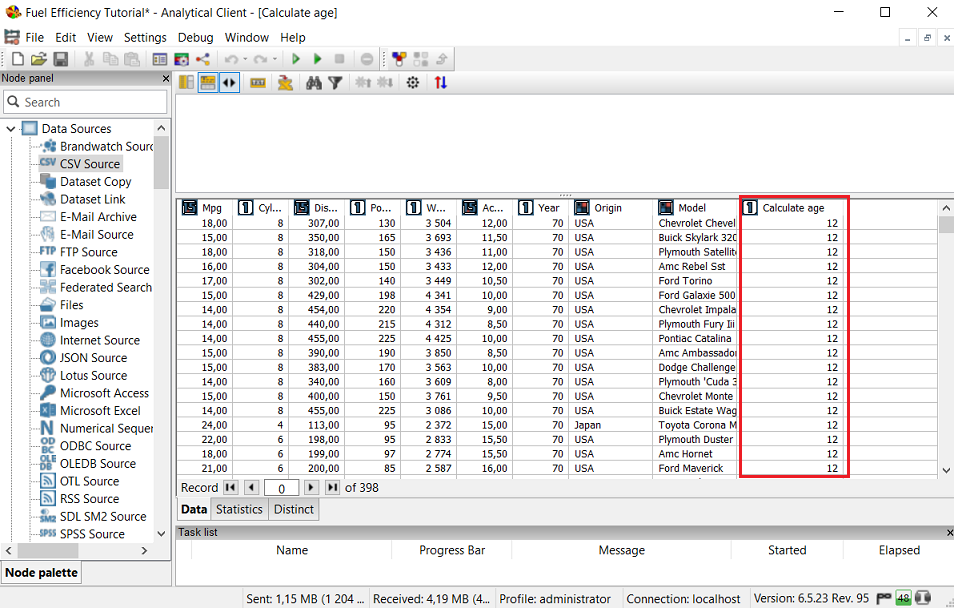
Switch to the General tab, name the node "Calculate Age" and then execute it. Take a look at the view. We can now see the various ages of the cars at the time the data was collected. The new column, Age, appears on the far right (the last column in the dataset) so you may need to scroll to the right. The cars in the following screenshot are all about 12 years of age.
Understanding reusable output
One of the benefits of PolyAnalyst’s flowchart design is how it caches the results of nodes. If you noticed, when you executed the Derive node, the CSV Source node did not execute again. This is because the CSV Source node already completed its execution in a previous step, cached the results (saved the imported data inside PolyAnalyst), and simply used the cached data as input to the Derive node. We could have executed the CSV Source node again, but there was no need. We would only need to re-execute the CSV Source node if we changed its configuration, or changed something that in some way changed the results of importing the CSV file (chose a different file, changed around column types, etc.). This tutorial deals with a relatively small dataset. The saved processing time is much more appreciable when working with millions of records. This is also part of the reason why it is important to spend the time making sure the data source node is properly configured.
A second benefit of the flowchart design is that we now have two datasets to work with. We can easily reuse the output of the CSV Source node as input to any number of other nodes. We are not forced to only work with the output of the Derive node from here onward. Other software systems often restrain you to working with only the modified dataset, but here we have the option of working with the original and the modified together.
One common confusion is for users to think that the Derive node modifies the data stored by the CSV Source node, but it does not. It creates an entirely new dataset that is independent of the original. Changes to data made by nodes later in the sequence do not affect the data or configuration produced by earlier nodes. This is an important concept to remember. Another technical note, for those users who are concerned about the performance and scalability of such a setup where data is replicated each time it is used in a subsequent node, is that PolyAnalyst implicitly performs optimizations of the reproduced datasets. On the surface, the dataset produced by the Derive node is indeed separate and different than the dataset produced by the CSV Source node. Behind the scenes, the Derive node output is actually made up of two parts, the original dataset plus one new dataset consisting of a single column (age in this case). When you view the output of the Derive node, you see one dataset, but what you are actually seeing are two datasets presented horizontally in a seamless fashion (first the columns from the input followed by the newly created columns added by the Derive node). This explanation is provided to alleviate the scalability concerns, and generally it is acceptable to conceive of the dataset produced by the Derive node as separate, new, and independent.