Scoring data using the Factor Analysis node
| This node/feature is available only if it is enabled in the PolyAnalyst Server license. |
The Factor Analysis node generates a model. It is represented in a form of so called factor scores, taking into account the weight of each elementary factor. The number of generated columns equals to the max extracted factors count.
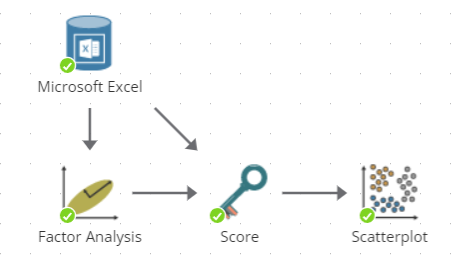
Also we can use the Scatterplot node on the results of our model. This procedure is appropriate for further investigation of extracted factors, it can also help us to find new dependences in our data. The project view is following:
The results of Scatterplot graphical report could be represented in new Factors coordinates. A color represents some attribute (not numerical attributes, as they can be targeted from other types of exploration).
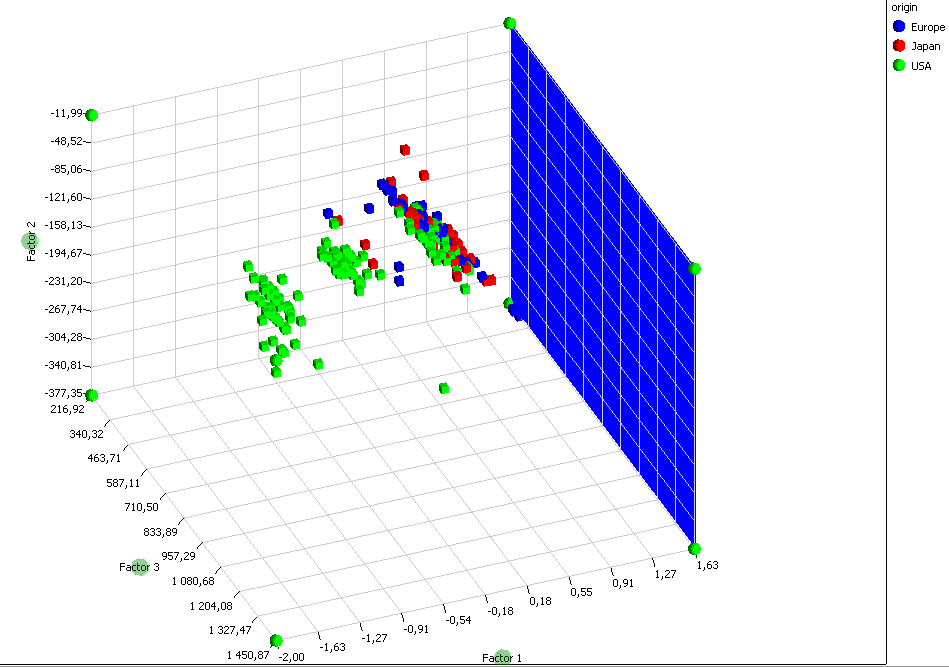
In this picture we can see that new principal component coordinates can give us a suitable direction for further investigation on data dependences.