About the results of the Dataset Filter node
| This node/feature is available only if it is enabled in the PolyAnalyst Server license. |
The view of the Dataset Filter node, much like other nodes in PolyAnalyst, is the standard data grid that displays the input dataset, again. The only difference is that in the toolbar, some new buttons are visible: Create filter, Create Subset, Create Filter Rows and Create Derive.

The last three are disabled until you create a filter, i.e. set a condition to filter the records of the input dataset.
To create a filter and filter the dataset in real time by entering parameters for selected columns, click the Create filter button.
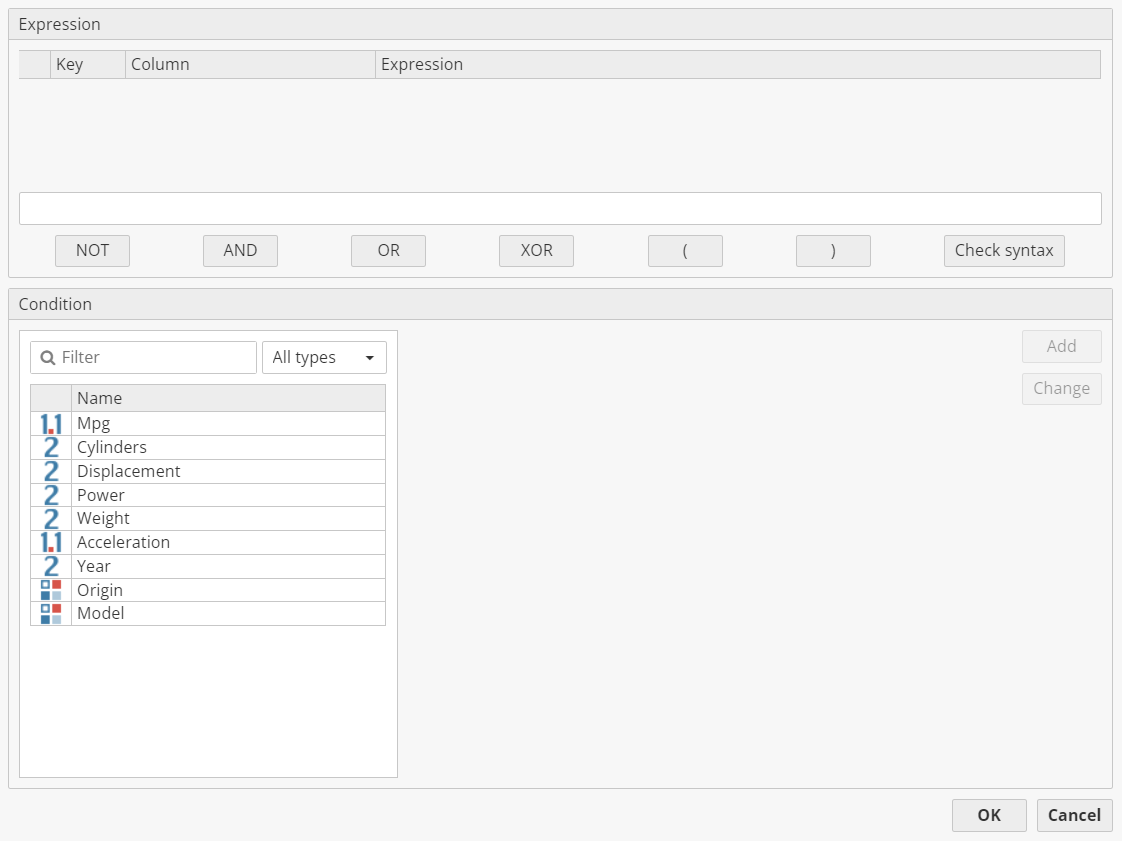
This dialog consists of two parts (group boxes). The upper one (Expression) contains a list control element with atomic expressions (predicates of single attributes). Each list item has a small delete button, expression denominator (A1, A2, - ) and expression description (or complete tooltips pop-up if the descriptions are long). Clicking the delete button displays a confirmation dialog and deletes the element from the list.
Below this list there is an edit box for combining atomic expressions with command buttons: NOT, AND, OR, XOR, (, ), Check syntax. Clicking the first six buttons inserts the corresponding command in the edit box in the place of the cursor.
In the lower group box (Condition) the user adds or changes the atomic expression. On the left there is a list view with all available dataset columns. Selecting the column fills the right part with the controls, depending on the selected column type.
-
For strings and categories it shows a multi-select list control with all category values.
-
For numbers and integers – two edit boxes for exact borders.
-
For dates – two date/time pickers for exact borders.
-
For Booleans – two checkboxes.
-
For texts – a multi-line edit box with highlighting.
Also, there are the following controls in this group box:
-
Add – adds the current condition to the upper list view (in the Expression field). Also, the condition is added (AND–ed) in the edit box of Expression.
-
Change – enabled only if the user has selected an atom in the Expression field. In this case the Condition box is filled with the data from the current condition. Clicking the Change button modifies this condition.
-
OK – closes the dialog and applies the current filter to the dataset.
Clicking the Create filter button when the dataset is already filtered shows this dialog pre-filled with the expression which is currently used.
To apply the filter, select a column from the list. Choose a comparison method, and then choose a comparison value. Then click Add. Before adding a second or third value, consider using an interceding AND or OR Boolean operator to create a correct expression.
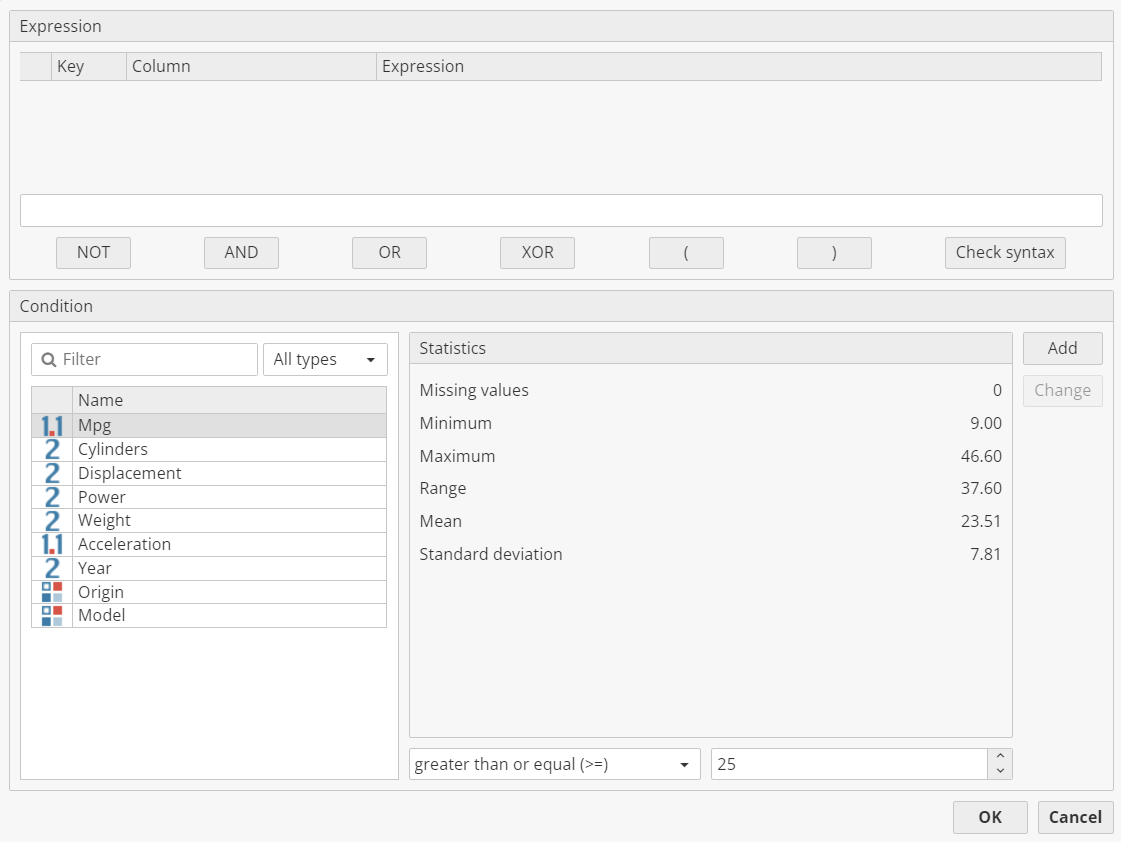
The dialog also displays some statistics about the column to assist in choosing a comparison value. When finished, click OK.
The view instantly updates to show only those records which match the criteria. This is an easy way to query a dataset, as it is performed graphically and does not require any knowledge of PolyAnalyst’s SRL, which is required when using some of the other nodes such as the Filter Rows node.
If a filter was performed, the 3 buttons on the end of the toolbar become enabled. Users can generate a Subset, a Derive, or a Filter Rows node which contains the expression that was generated by configuring the filter.
The Create Subset button automatically generates a new Subset node that includes only the subset of records that matched the currently configured filter (if any filter is configured). The new Subset node is connected to the same node as the Dataset Filter node. Creating a subset is a quick and convenient process in comparison to other methods of saving a subset of data. In this manner an analyst can create a Dataset Filter node, interactively configure various filters and save the resulting subsets of data as individual subset nodes for later reference and further analysis. A drawback of this is that the Subset node only works for the exact input dataset used by the Dataset Filter node. New subset nodes are not guaranteed to work correctly if they are detached and linked to different input nodes.
The Create Filter Rows button automatically generates a new Filter Rows node. The expression of the new node is equivalent to the current filter configuration. This button makes it easy to generate new Filter Rows nodes that store specific subsets of data. The Filter Rows node can easily be detached from the parent node and get a connection from a different node with a different dataset (say, a later version of the previous dataset with much bigger number of records). The Filter Rows node expression can be easily customized and changed at a later point in time, which is better than the Subset node that does not provide an interface to configure its expression (subset nodes actually do not store an expression, just a list of the matching row offsets). However, subset nodes will execute much faster than row-filtering nodes as the Subset node only renders a list of rows, whereas the Filter Rows node must evaluate the condition for each input record every time it is executed. However, if the input dataset is constantly changing (new rows or deleted rows), then the Filter Rows node will continue to work because it is only the expression itself that is constant, while the Subset node would fail because its "row pointers" are not guaranteed to be present after executing parent dataset nodes additional times.
The Create Derive button automatically generates a new Derive node that includes a single new column. The new column is a Boolean column that can be true or false. It is true if the configured filter would match the given record, otherwise it is false. The Derive node only needs to generate an additional column, so it is more space-efficient than creating a separate Filter Rows or Subset node that involves storing record information redundantly. This also provides a way to store a single dataset that contains both records that matched the filter and did not match the filter, whereas subset and filter rows nodes only store records that match the filter. The Derive node’s new column expression can also be easily edited at a later point in time, making it convenient to use the Dataset Filter as an 'expression starter' that makes it easy to create various Derive node new column expressions.
Designing Filter Expressions in the Report Editor
Filter expressions are configured for dataset filter objects added as report objects in the Report Editor. The expression accepts the following tokens:
-
AND, OR – logical operations between subparts of the expression. Examples: DATE_START >=
DstartAND DATE_START <Dend -
ONEOF, NONEOF – special functions for string/category variables. Example: ONEOF(PATIENT_ID,
Spatientid); NONEOF(DIAGNOSIS, - MVA - , - IHD - ) -
<, >, < =, >=, =, <> – for comparison of numbers, dates, relevance and possibly strings or categories. Example: MPG >
Nmpg; Origin !=Sorigin. -
Yes/no parameter (i.e.
B-sex) – filters dataset values matched any selected value of the parameter. Example: SEX =Bsex; SEX = yes -
Text parameter (i.e.
T-notes) – returns relevance of applying parameter value (PDL expression) to the text cell. This relevance should be compared with another numerical constant or parameter. Examples:Tnotes> 0;Tnotes>Nrelevance.
Parameters should be enclosed in back-quotes (`) and prefixed with one of following letters: T(text), S(string), C(category), B(yes/no), D(date), N(number).
Using Filters in the Report Editor
When viewing, the control appears as an ordinary data grid without a toolbar. The settings of the data grid are displayed in the node properties in the Report Editor. Selecting the Edit parameters option from the pop-up menu shows the filter dialog. It consists of the list of parameters and a set of controls, which varies depending on the currently selected parameter. The user clicks on the parameter in the list, sets its value in the right part of the dialog, and presses OK to see the filtered results.
-
For strings and categories it shows multi-select list control with all category values.
-
For numbers and integers – an edit box for values.
-
For dates – a date/time selector.
-
For Boolean values – three checkboxes (set, cleared or empty).
-
For texts – a multi-line PDL editor.